Exploiting Qualcomm EDL Programmers (4): Runtime Debugger
*
In the previous part we explained how we gained code execution in the context of the Firehose programmer. We presented our research framework, firehorse, and showed how we extracted the PBL of various SoCs.
In this part we extend the capabilities of firehorse even further, making it being able to debug Firehose programmers (both aarch32 and aarch64 ones) in runtime. Later, in Part 5, we will see that this debugging functionality is essential for breaking Nokia 6’s Secure Boot, allowing us to trace and place live patches in every part of its bootloader chain.
Implementing Breakpoints
A defining property of debuggers is to be able to place breakpoints. Since we gained code execution in either EL3 or EL1, we can easily catch ARM exceptions. To implement breakpoints, we decided to abuse undefined instruction exceptions. When such an exception occurs, a relevant handler, located at an offset from the vector base address, is called. Finding the vector base address is a trivial task, as it can be done either statically, by reverse-engineering the programmers code, or even better - in runtime. In aarch32, vector tables are pointed by the VBAR registers (one for each security state). Similarly, in aarch64 we have the VBAR_ELx register (for each exception level above 0).
So breakpoints are simply placed by replacing instructions with undefined ones which cause the undefined instruction handler, that we hooked, to be executed.
Recovering from Breakpoints
Catching breakpoints is only one side of the coin, the other – recovery and execution of the original instruction. Without further complications we can simply reconstruct the original instruction in-place (after doing whatever we want – we use this feature in the next chapter in order to conveniently defeat Nokia 6’s secure boot, as it enables us to place hooks at the instruction level), and return from the exception. This method has a small price to pay. Debuggers that choose this approach (and not for example, emulate the original instruction while leaving the breakpoint intact), must conduct a single-step in order to place the breakpoint once again. Unfortunately, aarch32 lacks single-stepping (even in ARMv8). Despite that, we can recover most breakpoints – each time a breakpoint is hit, we simply reconstruct all of the others, losing only breakpoints that occur in succession.
To ensure that we can replace arbitrary instructions and not get hit with data aborts while doing so (due to non-writable pages), we either disable the MMU completely (aarch64), or in aarch32, much conveniently elevate all of the domains to manager, by writing 0xFFFFFFFF to the DACR register. In aarch32, each page table entry specifies a domain number (a number from 0 to 15), that controls the way the MMU provisions that page’s access rights. A domain set to manager instructs the MMU to always allow access (i.e. ignore the access righs completely). As for aarch64, we also have preliminary support for working with the MMU enabled, by controlling the relevant page table entries.
Special care was also needed for Thumb. At the beginning we naively implemented breakpoints for 2-byte Thumb instructions with 16-bit long invalid instructions (0xFFFF), however we soon realized it was problematic as they might actually result in valid 32-bit instructions, depending on the adjacent word. Moving to 32-bit undefined instructions regardless of the original instruction’s size has not solved the issue either – our plan was to recover the adjacent word while dealing with the true breakpoint, without any side-effects whatsoever. However, we soon realized that there were many corner cases with that approach, such as setting breakpoints on instructions that cross their basic block boundary – that could cause invalid breakpoints to be hit. Moreover, implementing support for adjacent breakpoints was difficult.
We have finally solved the problem by reading through the ARM Architecture Reference Manual, finding that there is an actual instruction that is guaranteed to be permanently undefined (throw ‘undefined instruction’ exception), regardless of the following word. Its 16-bit encoding is XXDE.
Debugger Output
The following example shows the UART output of our debugger running in the context of the OnePlus 5 programmer:
B - Resolved breakpoint: 0
B - reproducing instruction 4: 1402c958 = a9bb67fa
B - reproducing breakpoint 4: 1402c964 = ffffffff
B - x00 0000000000000010 x01 00000000140193ab x02 0000000000000006 x03 0000000000000006
B - x04 0000000000000040 x05 0000000000000050 x06 0000000000000006 x07 0000000000000000
B - x08 000000001402c958 x09 000000001406c180 x10 0000000000000000 x11 fefefefefefefeff
B - x12 0080000000008000 x13 0000000000000000 x14 0000000000000010 x15 0000000000000001
B - x16 000000000000003e x17 5000000000000000 x18 1000000000000000 x19 000000001406b0b8
B - x20 000000001406c808 x21 00000000140193ab x22 000000001407d348 x23 0000000000000015
B - x20 000000001406c808 x21 00000000140193ab x22 000000001407d348 x23 0000000000000015
B - x24 0000000000000001 x25 0000000000001000 x26 000000001406b510 x27 000000001407d348
B - x28 0000000000000098 x29 0000000014074000 x30 000000001402be48, sp 000000001406af90
B - CurrentEL 0000000000000001
B - ELR_ELx 000000001402c958
B - ESR_ELx 0000000002000000
B - FAR_ELx 0000000000000000
B -
On Xiaomi 5A’s aarch32 programmer the debugger prints the following:
B - AAA-3000-boot_sdcc_hotplug-0
B - r00 0000001b r01 0802551d r02 0805cbb8 r03 00000000
B - r04 00000000 r05 0805cc80 r06 08067560 r07 0805c9e8
B - r08 a7f90197 r09 00000000 r10 01000001 r11 00000000
B - r12 000000ff sp  00000024  lr 0802c932
B - spsr 600000f3 cpsr 200000db dfar 03e1f12e ifar 4ffa5020
B - dfsr c3103f01 ifsr 00000430 dacr ffffffff
B - bkva: 0802c930 bkinst: 47f0e92d instsize:  4
B - fixed lr=0802c930, reproduced instruction: 47f0e92d
Position-Independent Debugger
A significant feature of our debugger is that it is fully relocatable, and its memory layout is configurable depending on the target. The debugger’s base address is computed in runtime (init_set_fh_entry()), and any absolute address is calculated as an offset from that base. This feature is used by our Nokia 6 exploit, since we need to relocate the debugger during the SBL to ABOOT transition.
Host-to-Device Data Sharing
The debugger receives the list of breakpoints, patches, and pages to be copied (more on this in the next part) to perform from the host script, by abusing the Firehose protocol (either with the poke primitive or more rapidly using a functionality we developed that is described next).
Specifically, the host uploads the following data structure, to FIREHORSE_BASE + ADDR_SCRATCH_OFFSET:
typedef struct
{
    u_int{8,64} mode;
    u_int{32,64} bplen;
    u_int{32,64 patchlen;
    NULL,NULL,NULL,
    bp bps[bplen];
    patch patches[patchlen];
    pcopy pc[];
} firehorse;
The inner structures are described here (32 bit) and here (64 bit).
Fast Host-to-Device Data Upload
One significant problem we encountered during the development of the debugger is that upload rate over poke is extremely slow. This very poor throughput is due to the fact that each poke only allows uploading 8 bytes (encoded as 16 bytes) at a time, with 499 pokes per XML.
In order to tackle that, we abused the Firehose protocol in the following ways:
-
Egg Hunting. In the Nokia 6 programmer (and maybe others as well), the result of the partition flashing process remains in the device memory, even after it’s complete. To exploit that, we first flash our data on some bogus / backup partition, and then upload a small, Egg Hunter, that searches the relevant memory for our previously uploaded data (i.e. the Egg).
-
XML Hunting. For some programmers our flashed data did not remain in memory. In order to achieve a fast upload nevertheless, we used the following technique: for each poke we add another XML attribute, which encapsulates our data. Some encoding was needed too. Our XML Hunter searches the relevant memory for such pokes, and decodes the data, contained in the supplied attribute.
<?xml version="1.0" ?>
<data>
<poke address64="stack_execaddr" SizeInBytes="8" value="XMLHunterAddress" fh="encoded_data"/>
</data>
Function Tracing
A usuable feature of our host script is that it can be fed with a list of basic blocks. This list can be generated using the following IDA Python script:
from idautils import *
from idaapi import *

for segea in Segments():
  for func in Functions(segea, SegEnd(segea)):
     fref =  get_func(func)
     fname = GetFunctionName(func)
     flow = FlowChart(fref)
     for bb in flow:
       print '%s %d %08x %d %s' % (fname, bb.id, bb.start_ea, ItemSize(bb.start_ea), GetDisasm(bb.start_ea))
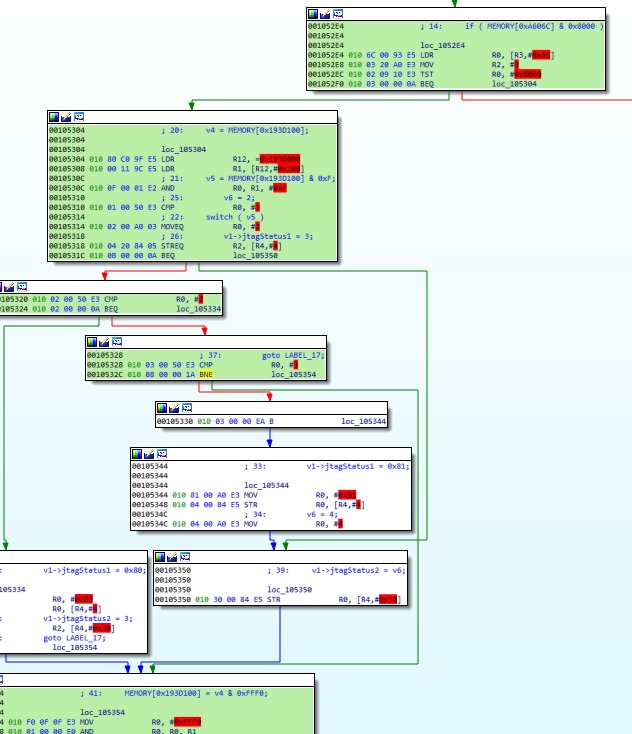
For example, here is the list of basic blocks generated for the pbl_sense_jtag_test_edl function discussed in Part 1:
pbl_sense_jtag_test_points_edl 0 0010527c STMFD           SP!, {R4-R6,LR}; Store Block to Memory
pbl_sense_jtag_test_points_edl 1 00105288 MOV             R3, #0; a4
pbl_sense_jtag_test_points_edl 2 0010529c MOV             R0, #0; Rd = Op2
pbl_sense_jtag_test_points_edl 3 001052b4 LDR             R0, [R3,#0x2C]; Load from Memory
pbl_sense_jtag_test_points_edl 4 001052c4 MOV             R3, R5; a4
pbl_sense_jtag_test_points_edl 5 001052d8 STR             R5, [R4,#4]; Store to Memory
pbl_sense_jtag_test_points_edl 6 001052dc MOV             R0, #0; Rd = Op2
pbl_sense_jtag_test_points_edl 7 001052e4 LDR             R0, [R3,#0x6C]; Load from Memory
pbl_sense_jtag_test_points_edl 8 001052f4 STR             R2, [R4,#4]!; Store to Memory
pbl_sense_jtag_test_points_edl 9 00105304 LDR             R12, =0x193D000; Load from Memory
pbl_sense_jtag_test_points_edl 10 00105320 CMP             R0, #2; Set cond. codes on Op1 - Op2
pbl_sense_jtag_test_points_edl 11 00105328 CMP             R0, #3; Set cond. codes on Op1 - Op2
pbl_sense_jtag_test_points_edl 12 00105330 B               loc_105344; Branch
pbl_sense_jtag_test_points_edl 13 00105334 MOV             R0, #0x80; Rd = Op2
pbl_sense_jtag_test_points_edl 14 00105344 MOV             R0, #0x81; Rd = Op2
pbl_sense_jtag_test_points_edl 15 00105350 STR             R0, [R4,#0x30]; Store to Memory
pbl_sense_jtag_test_points_edl 16 00105354 MOV             R0, #0xFFF0; Rd = Op2
pbl_sense_jtag_test_points_edl 17 0010536c B               loc_1052DC; Branch
Then, one can call our breakpoints manager’s break_function or trace_function in order to break on a function’s entry, or break on all basic blocks, effectively tracing its execution.
Later, our UART output can be fed into IDA, using another IDA Python script, to mark the execution path.
`
Upcoming Next; Owning Nokia’s 6 Chain-of-Trust Using the Debugger
In this part we described our debugging framework, that enabled us to further research the running environment.
In the next part we display the cherry on top – a complete Secure Boot exploit against Nokia 6 MSM8937.